Excel for Accountants & Financial Analysts – Data Analysis, PivotTables, Power Query & Financial Modeling
عدد الدروس : 416 عدد ساعات الدورة : 88:48:55 شهادة معتمدة : نعم التسجيل في الدورة للحصول على شهادةللحصول على شهادة
- 1- التسجيل
- 2- مشاهدة الكورس كاملا
- 3- متابعة نسبة اكتمال الكورس تدريجيا
- 4- بعد الانتهاء تظهر الشهادة في الملف الشخصي الخاص بك
قائمة الدروس
عن الدورة
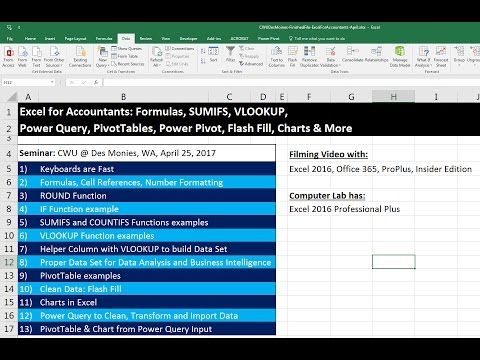
This Excel for Accountants & Financial Analysts course is designed to build strong Excel skills for finance, accounting, and data analysis roles. It focuses on practical tools used in real financial reporting, data cleaning, and analysis.
The course starts with essential Excel functions such as IF, SUMIFS, VLOOKUP, and formatting techniques used to build accounting templates. You will learn how to use PivotTables and slicers to summarize and analyze large financial datasets quickly and efficiently.
A major part of the course covers Power Query, which is used to import, clean, and transform data for reporting. It also introduces advanced lookup formulas and techniques using VLOOKUP, INDEX, and other functions for financial analysis.
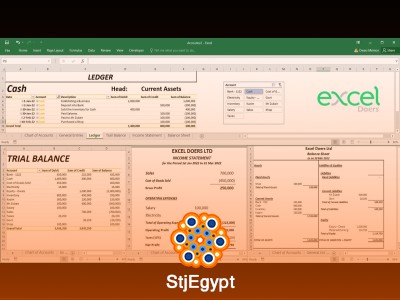
You will also explore Excel charts, dashboards, and reporting tools that help visualize financial performance. The course includes full financial modeling concepts, data analysis workflows, and integration with Power BI for advanced reporting.
By the end of this course, learners will be able to build professional financial reports, analyze accounting data efficiently, and use Excel confidently in accounting and finance roles.