Excel & Data Visualization – 365 Data Science
عدد الدروس : 12 عدد ساعات الدورة : 02:13:17 شهادة معتمدة : نعم التسجيل في الدورة للحصول على شهادةللحصول على شهادة
- 1- التسجيل
- 2- مشاهدة الكورس كاملا
- 3- متابعة نسبة اكتمال الكورس تدريجيا
- 4- بعد الانتهاء تظهر الشهادة في الملف الشخصي الخاص بك
قائمة الدروس
عن الدورة
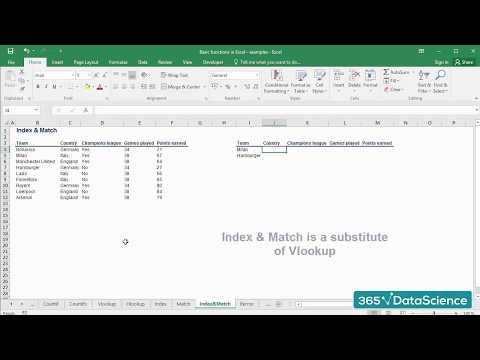
This Excel & Data Visualization course from 365 Data Science is designed to give learners hands-on experience with key Excel functions and data visualization tools commonly used in analytics and BI roles. The series starts with foundational Excel techniques, such as Index, Match, VLOOKUP, Select Special, and Text to Columns, which help in efficiently managing, cleaning, and analyzing data sets. Learners then explore lookup functions and combinations of Excel functions to perform complex data queries and analysis.
The course also emphasizes the practical application of data visualization principles, covering how to create bar charts and other visualizations in Python, R, Tableau, and Excel. It includes guidance on when to use Tableau versus Excel to represent data effectively for decision-making purposes. Advanced Excel applications, including combined use of INDEX and MATCH functions, are also covered to enhance analytical capabilities.
By completing this series, learners gain the skills to manipulate large datasets, perform accurate data lookups, and present insights clearly through visualizations. These competencies are essential for roles in data analytics, business intelligence, and reporting.